Newsletter Subscribe
Enter your email address below and subscribe to our newsletter

Frequently Asked Questions
To check CPU temperature in Windows 11 or Windows 10, use a hardware monitoring tool such as HWiNFO, Core Temp, or Libre Hardware Monitor. Windows Task Manager does not display live CPU temperature. It may display GPU temperature on supported dedicated graphics cards, which is why the two values are sometimes confused.
This guide shows five practical methods, explains which sensor value you should watch, and helps you decide whether your processor is running normally or getting too hot.
For most users, HWiNFO in Sensors-only mode is the best option. It provides live readings while Windows is running and records the current, minimum, maximum, and average temperature. This makes it useful for checking the processor at idle, during gaming, or while running demanding applications.
| Method | Best for | Live reading | Extra software |
|---|---|---|---|
| HWiNFO | Detailed monitoring and troubleshooting | Yes | Yes |
| BIOS or UEFI | A quick check without installing a program | No, only while Windows is not running | No |
| Core Temp | A simple view of processor and core temperatures | Yes | Yes |
| Libre Hardware Monitor | Free and open source hardware monitoring | Yes | Yes |
| PowerShell and WMI | A limited ACPI thermal zone check | Sometimes | No |
Windows 11 and Windows 10 do not include a reliable built-in screen for live CPU temperature. You can view processor usage, clock speed, processes, threads, and uptime in Task Manager, but not the CPU temperature.
You can also read the original German version of this guide on Windows-FAQ.de.
Diesen Artikel auf Deutsch lesenThe only useful method without installing another program is the BIOS or UEFI hardware monitor. However, that reading is taken before Windows and your normal applications have loaded. It cannot show how hot the processor becomes during a game, video render, software build, or stress test.
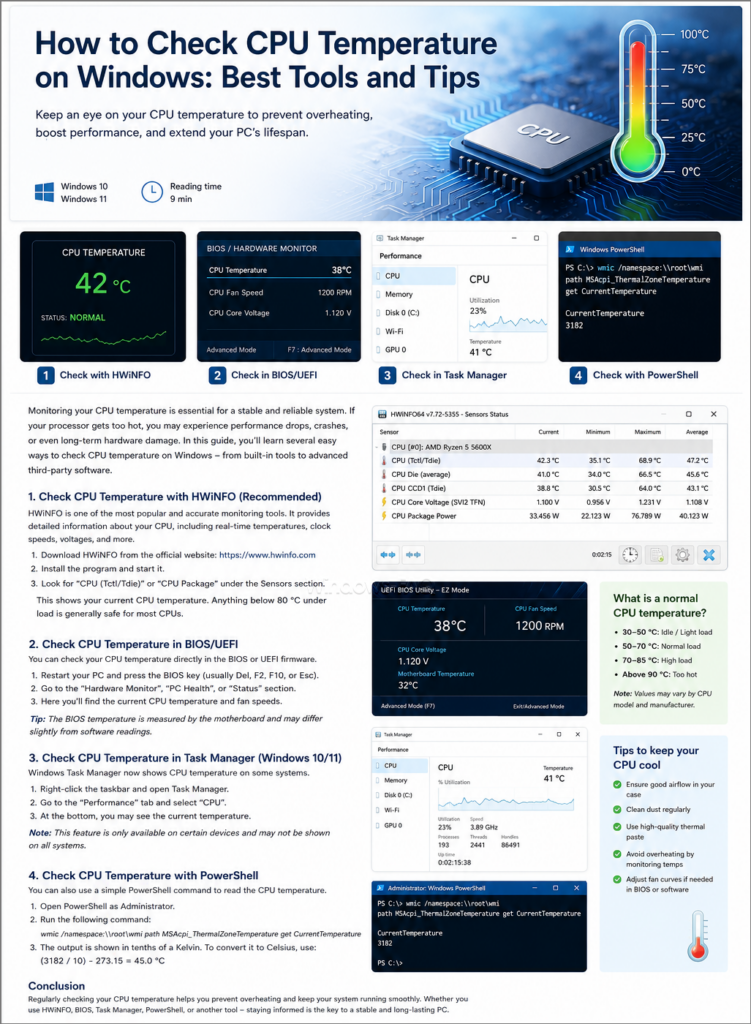
HWiNFO is a detailed hardware monitoring and diagnostic tool for Windows. It can read processor temperature sensors, fan speeds, voltages, clock speeds, power consumption, and many other values. The amount of information can look overwhelming at first, but you only need a few entries for a normal temperature check.
Sensors-only.CPU Package, Core Max, CPU (Tctl/Tdie), or CPU Die (average).Maximum column to see the hottest recorded value.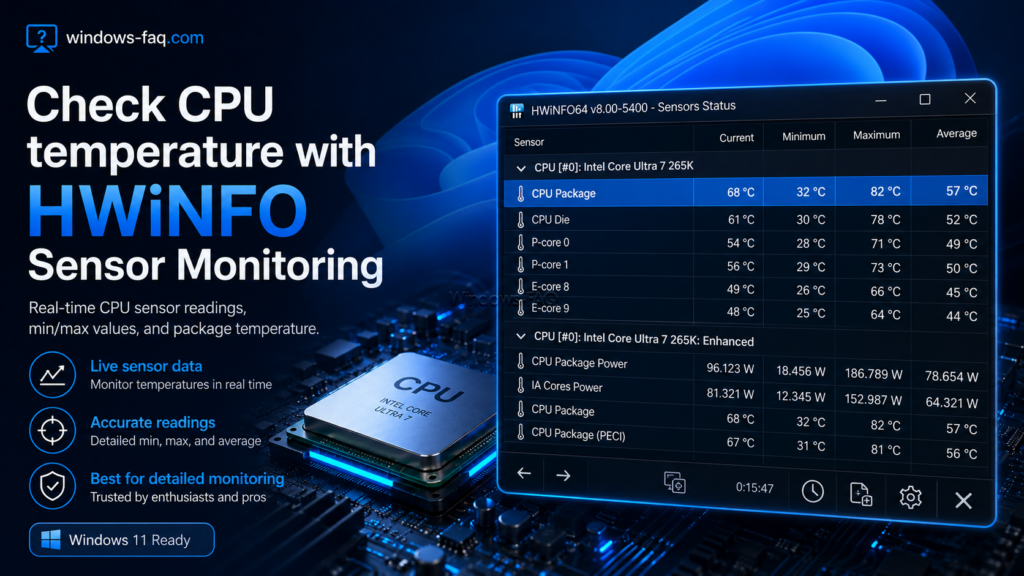
On an Intel system, CPU Package is usually the most useful overall reading. Core Max shows the hottest individual processor core and can reveal a hot spot that an average value would hide.
On many AMD Ryzen systems, CPU (Tctl/Tdie) is the control temperature used for thermal management and fan behavior. CPU Die (average) can provide a smoother average of the processor die. The exact sensor names vary by processor generation and motherboard.
Do not compare a motherboard entry simply called CPU with the processor’s internal digital sensor without checking what it represents. A socket or motherboard sensor may react more slowly and may show a noticeably different value.
Open HWiNFO before starting the program or game you want to test. Reset the minimum and maximum values, run the workload for 10 to 20 minutes, and then review the Maximum column. This gives you a more useful result than looking at a single temperature immediately after Windows starts.
Most desktop motherboards and many laptops include a hardware monitoring page in the BIOS or UEFI. It may be named Hardware Monitor, PC Health, System Monitor, H/W Monitor, or Fan Control.
Settings.System and then Recovery.Advanced startup, select Restart now.Troubleshoot.Advanced options.UEFI Firmware Settings and then Restart.You can also enter the firmware during startup. Depending on the PC manufacturer, the key may be Delete, F2, F10, F12, or Esc.
The firmware value is useful as a basic check, but it does not represent a normal Windows workload. The processor is under relatively light load in the BIOS or UEFI, and power management may behave differently there.
Core Temp is a compact program that focuses on processor temperature. It can display the temperature of individual cores when the processor exposes those readings, along with processor load, frequency, and the maximum junction temperature.
Options and Settings if you want to display a temperature in the notification area.Core Temp is easier to read than HWiNFO, but it provides fewer motherboard, storage, fan, and power sensors. It is a good choice when you only want a clear CPU temperature monitor.
Libre Hardware Monitor is a free and open source application that can monitor processor and graphics temperatures, fan speeds, voltages, loads, clock speeds, and storage devices.
Temperatures.Use the official GitHub repository rather than similarly named download websites. The project itself warns that it is not affiliated with the separate domain that uses the Libre Hardware Monitor name.
No. Task Manager does not show CPU temperature in Windows 11 or Windows 10. Open Task Manager with Ctrl + Shift + Esc, select Performance, and open the CPU page. You will see utilization, speed, process counts, logical processors, virtualization status, and uptime, but no CPU temperature field.
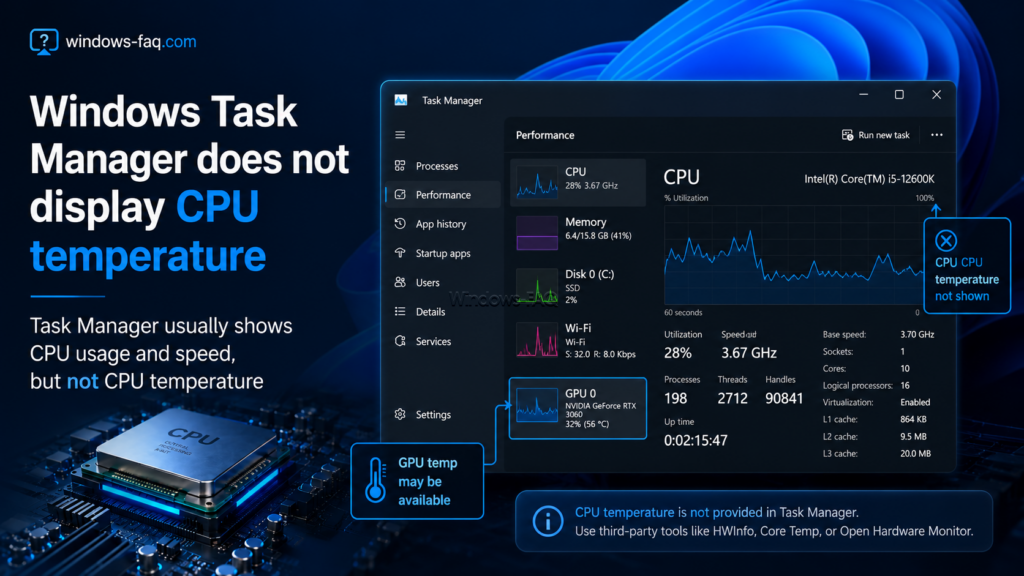
Task Manager can show GPU temperature on compatible systems. Microsoft introduced this feature for supported dedicated graphics cards and noted that a compatible graphics driver is required. A GPU reading in Task Manager is not the processor temperature.
PowerShell does not provide a universal command that reads the processor’s internal temperature sensor on every PC. It can query the Windows Management Instrumentation class MSAcpi_ThermalZoneTemperature, but the returned value may represent an ACPI thermal zone on the motherboard or inside the chassis rather than the actual CPU package.
Open Windows Terminal or PowerShell and run the following command:
Get-CimInstance -Namespace root/wmi -ClassName MSAcpi_ThermalZoneTemperature | Select-Object InstanceName, @{Name='TemperatureC'; Expression={ [math]::Round(($_.CurrentTemperature / 10) - 273.15, 1) }}The conversion is important because CurrentTemperature is commonly returned in tenths of a Kelvin. To convert it to Celsius, divide the value by 10 and subtract 273.15.
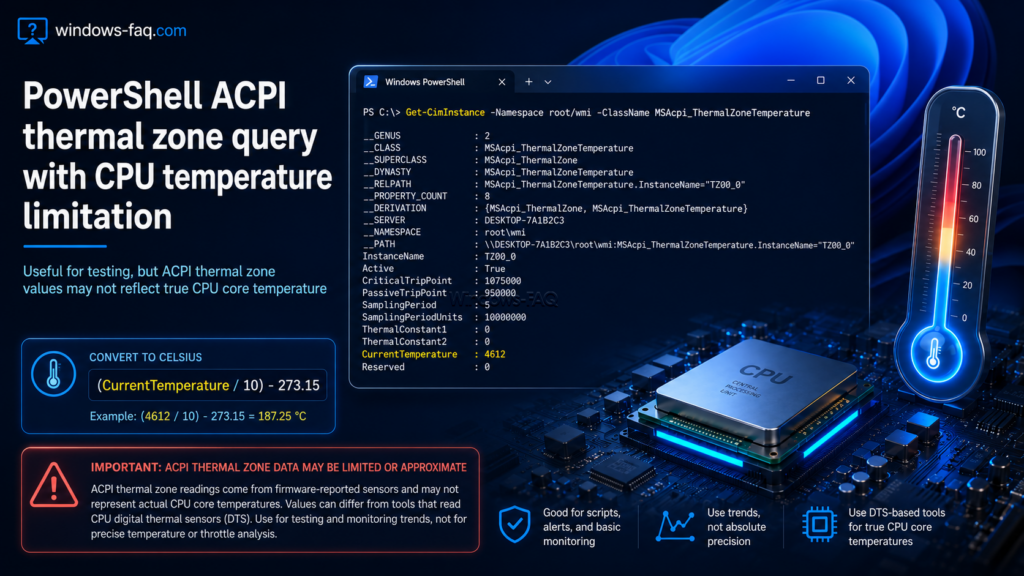
This method has several limitations:
Older guides often use the following command:
wmic /namespace:\\root\wmi PATH MSAcpi_ThermalZoneTemperature get CurrentTemperatureWMIC is a deprecated command line utility. Microsoft has removed it by default from newer Windows 11 installations and is completing its removal. The underlying WMI technology remains available, so Get-CimInstance is the modern replacement for this type of query.
There is no single normal temperature for every processor. The result depends on the exact CPU model, cooler, laptop or desktop design, case airflow, room temperature, power limits, and workload. Intel also states that it does not provide one typical operating range for all processors because system design and workload have a major effect.
The following values are broad troubleshooting guidelines, not universal specifications:
| Situation | Approximate temperature | How to interpret it |
|---|---|---|
| Idle or light use | 30°C to 50°C, 86°F to 122°F | Common for many well-cooled systems. Laptops and compact PCs may be warmer. |
| Gaming or sustained work | 60°C to 85°C, 140°F to 185°F | Often normal, depending on the processor and cooling design. |
| High temperature | 85°C to 90°C, 185°F to 194°F | Watch whether the value is sustained and whether clock speed begins to fall. |
| Very high temperature | Above 90°C, 194°F | Check the exact processor limit and inspect the cooling system if the reading persists. |
| Thermal limit | Depends on the model | Compare the reading with the processor’s Tjunction maximum or maximum operating temperature. |
Modern processors protect themselves by reducing clock speed and power when they approach a thermal limit. If throttling cannot keep the processor within a safe range, the system may shut down. This protection reduces the chance of immediate damage, but repeated operation at the limit can reduce performance and usually indicates that the cooling system deserves attention.
Performance and CPU, or open Settings, System, and About.Tjunction or Tcase under the package specifications.Max. Operating Temperature (Tjmax).Maximum temperatures vary significantly. Intel states that Tjunction maximum is usually between 100°C and 110°C for its processors, while AMD product specifications include values such as 89°C, 95°C, and 100°C depending on the model.
A real workload is often more useful than a synthetic stress test because it reflects how you actually use the PC. A stress test can still help with troubleshooting, but it creates an unusually demanding load. Stop the test if the system becomes unstable, reaches its thermal limit, or shuts down.
High CPU temperature usually has one or more of the following causes:
Open Task Manager with Ctrl + Shift + Esc and sort the process list by CPU usage. Close an application only when you recognize it and know that it is safe to stop. A Windows update, antivirus scan, game launcher, browser tab, or software build can create a temporary load.
Make sure desktop intake and exhaust vents are not blocked. Place a laptop on a hard, flat surface. Do not use it on a blanket, sofa, or other material that can cover the cooling openings.
Turn off the PC, disconnect power, and follow the manufacturer’s service instructions before opening the case. Clean filters, fans, heat sinks, and vents carefully. Prevent fans from spinning freely while using compressed air because excessive speed can damage a fan.
Confirm that the CPU fan is spinning and connected to the correct motherboard header. For a liquid cooler, check whether the pump is detected and whether its speed is plausible. Grinding, clicking, or sudden temperature spikes can indicate a mechanical problem.
Restore default BIOS or UEFI settings if the processor has been overclocked or if voltage and power limits were changed. Manufacturer performance modes can also raise temperature and fan noise. A balanced mode may provide a better compromise for everyday use.
If temperatures remain unusually high, the cooler may not make proper contact with the processor. Reseating a cooler and applying new thermal paste can help, but this requires the correct procedure and may affect a laptop warranty. Use a professional repair service when you are not comfortable working inside the device.
A higher capacity air cooler, a properly sized liquid cooler, or improved case fans may be required for a high-power processor. Check case clearance, socket compatibility, power limits, and the processor manufacturer’s recommendations before buying new cooling hardware.
The easiest reliable way to check CPU temperature in Windows 11 and Windows 10 is HWiNFO in Sensors-only mode. Core Temp provides a simpler view, while Libre Hardware Monitor is a useful open source alternative. BIOS or UEFI works without an installation, but it cannot show temperature during a normal Windows workload.
Do not rely on Task Manager for CPU temperature, and treat PowerShell ACPI values as limited diagnostic information. Always compare the maximum recorded temperature with the official Tjunction maximum for your exact processor model.